


Tampa Bay Rays Midseason Home Attendance Review 2007 to 2025
Rays home-heavy early schedule means better weather, but second half could have playoff boost

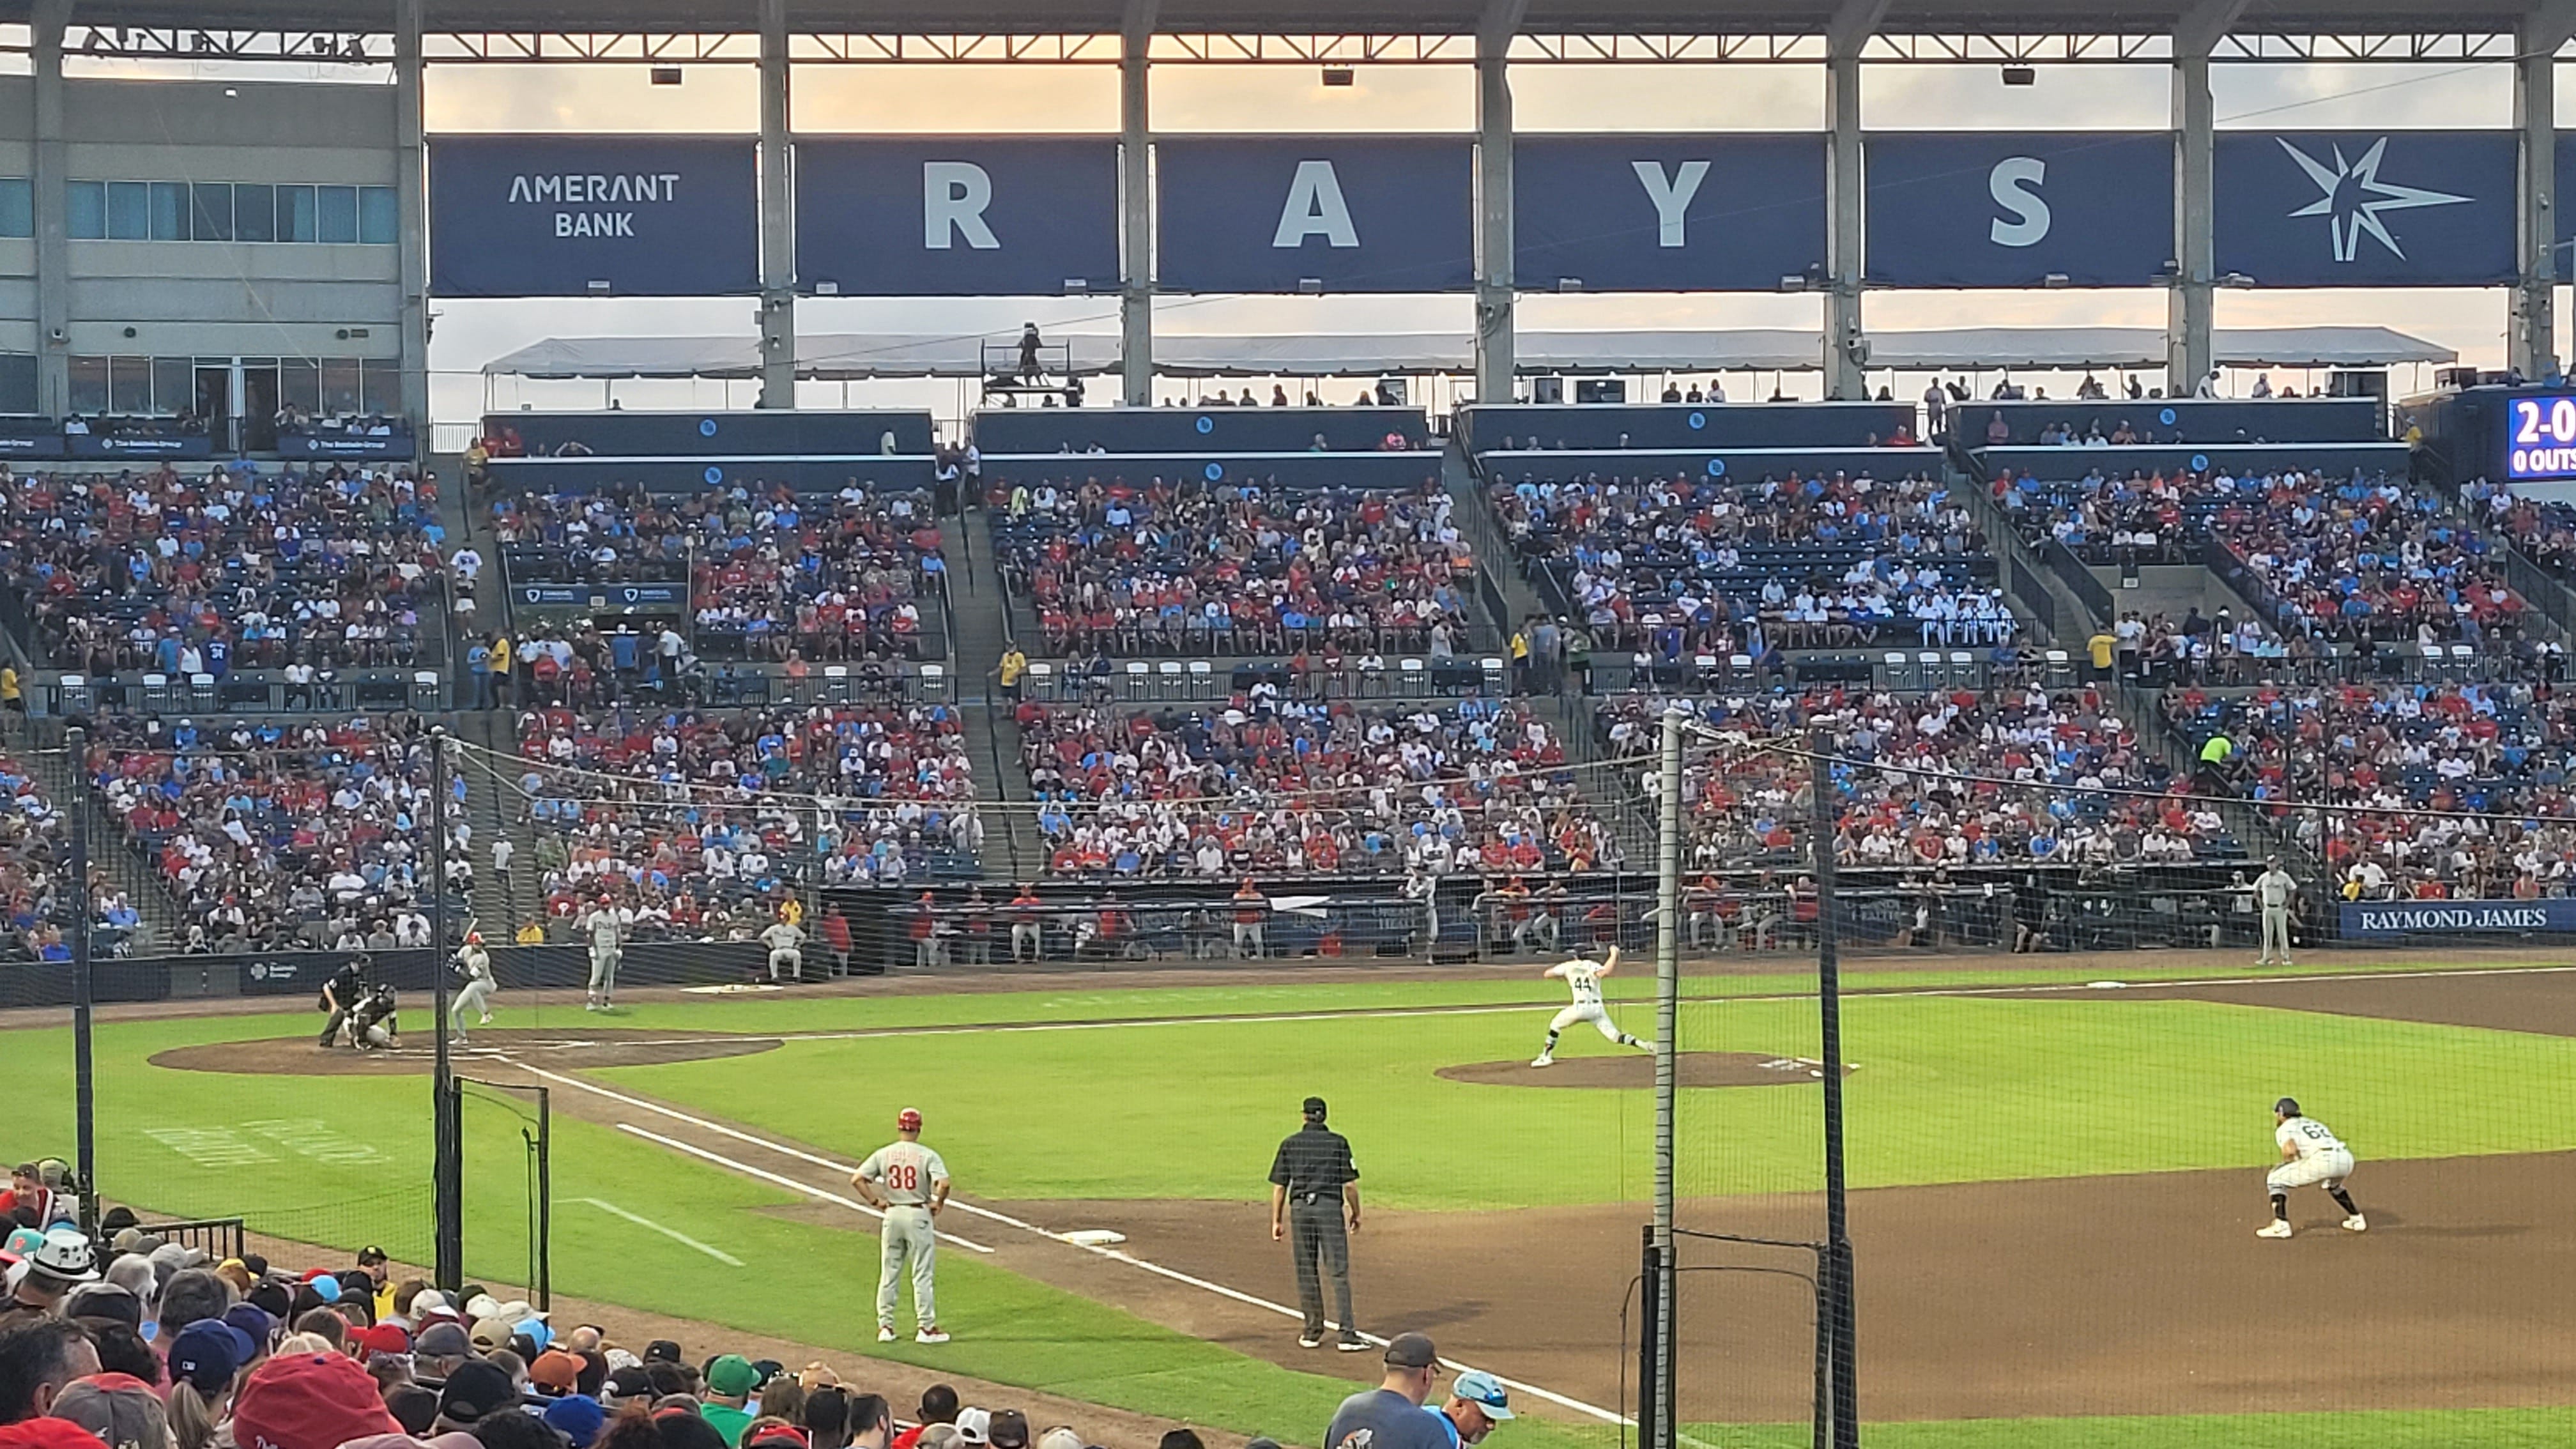
On Friday, June 6th, the Rays played their 41st home game of the 2025 season. This meant they were halfway done with their 81-game home schedule. At the 41 game point, Rays average home attendance was 9,821, nearly 98% of capacity of Steinbrenner Field, their home after Hurricane Milton.
June 6th is very early to be done with half the home schedule. The Rays purposefully moved a few series earlier to fit playing in an outdoor stadium in Tampa. Typically, the Rays reach Home Game 41 somewhere between June 20th and July 4th.
I haven’t updated my half-season attendance charts in almost nine years, so I figured this would be a great opportunity. I don’t think there will be many similar patterns between Tampa attendance and St Pete attendance, but let’s see what we can glean.
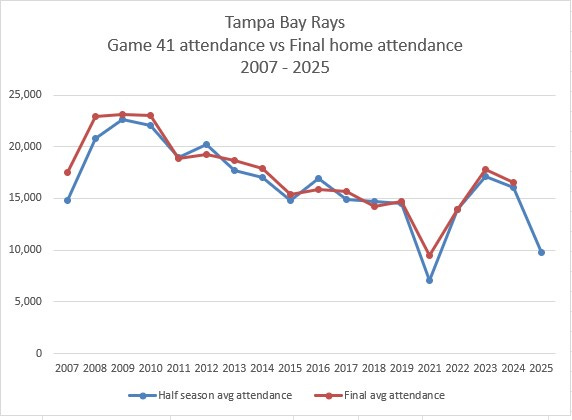
Before we get into my attendance prediction on the second half of 2025, let’s look at Game 41 attendance compared the Rays final attendance since 2007. Besides the fact that 2021 is an anomaly and 2025 is played in a smaller park, what we see is two lines following each other pretty closely.
The following chart depicts Rays average attendance at the 41-game point from 2007 to 2016. It also shows the final average attendance and whether there was a gain or loss in average attendance in the second half.
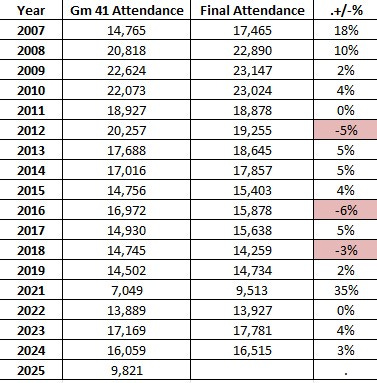
Of course, we disregard 2020 and have to consider 2021 in context, but what we have seen is slight increases in attendance in the second half of the season almost every year since 2007. This could be because of playoff contention or because of opponents. Attendance in the first half of the season could be lower due to regional interest in other sports such as hockey. And not to be underestimated, the second half of the season usually contains more July games, which is typically the Rays best attended month of the season.
Weekends vs Weekdays Midseason Analysis
After looking at increases or decreases from the first to the second half, the next step is to look at whether those increases are during the week or during weekends. The following chart depicts Weekend Average at Game 41 and Final Weekend Attendance Average from 2007 to 2025.
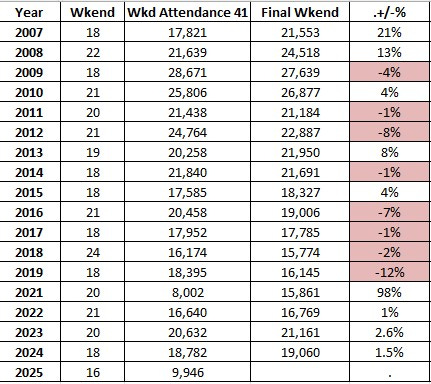
Again, disregarding 2021, we have 8 years of increases and 8 years of decreases on weekends during the second half of the season. The last 3 years have had slight increases. This might require a deep dive into the schedule. Are more attractive opponents coming to Tampa Bay in the first half of the season? Or again, perhaps it is because of the excitement of a potential postseason. This would require next level analysis.
Now let's look at Rays average weekday attendance from the first half to the second half.
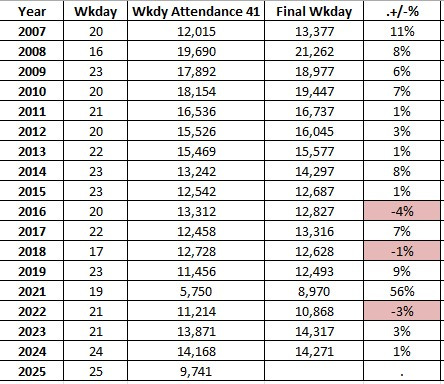
Again, throw out 2021. In 13 of 16 years, the Rays have seen increases in weekday attendance in the second half of the season. This could be because of opponents or because most of, if not all of July and early August when kids are out of school is typically in the second half.
I am curious what day of the week sees the greatest increase from the first half to the second half. Are Monday through Thursday effected equally? I might get to that some other time.
Conclusion and prediction for the second half of 2025
Although rare, I think the Rays see an attendance decline in the second half of 2025. Even if they are a playoff team, I think the Tampa Bay rainy season scares off possible attendees.
I don’t think the heat will play that big of a role. Getting 10,000 people to sit through 100 degree games shouldn’t be difficult out of a population of 3 million. But getting 10,000 people to sit in the rain is a different story. People don’t like getting wet.
I think a 5% decline is fair. Probably in the range of 9,500, leaving the Rays final attendance to be 9,650 or so. Which is 96% capacity, but should be better considering they are playing in a much smaller facility.